You need alerts for your alerts: the case of the leaking file descriptors
February 16, 2024
Read on Frameable's tech blog
The problem appears
A few weeks ago, the infrastructure team here at Frameable received a report from one of our colleagues that made us feel like the floor had dropped out from under us. Our internal monitoring system – codename ‘Canary’ – had been silently failing for days!
Canary is a small, simple NodeJs app that once a minute runs a series of simple health check pings against our most critical services. If Canary alerts, we know something is very wrong, and we can immediately drop everything and go fix the problem – which means if it’s not actually running, it could be left to customers to notice failures. Not good!
The service was running, but it didn't seem to be doing anything. After some initial investigation didn’t reveal anything obviously wrong – memory usage looked okay, cpu wasn’t going crazy, no obvious errors in the logs – I did what any good sysadmin would: I turned it off and on again. Restarting the docker container worked, and the service was up and running again. Nervously, knowing something wasn’t quite right but unable to reproduce the problem in my dev environment, I added a pile of debug logging everywhere, and left the service to run.
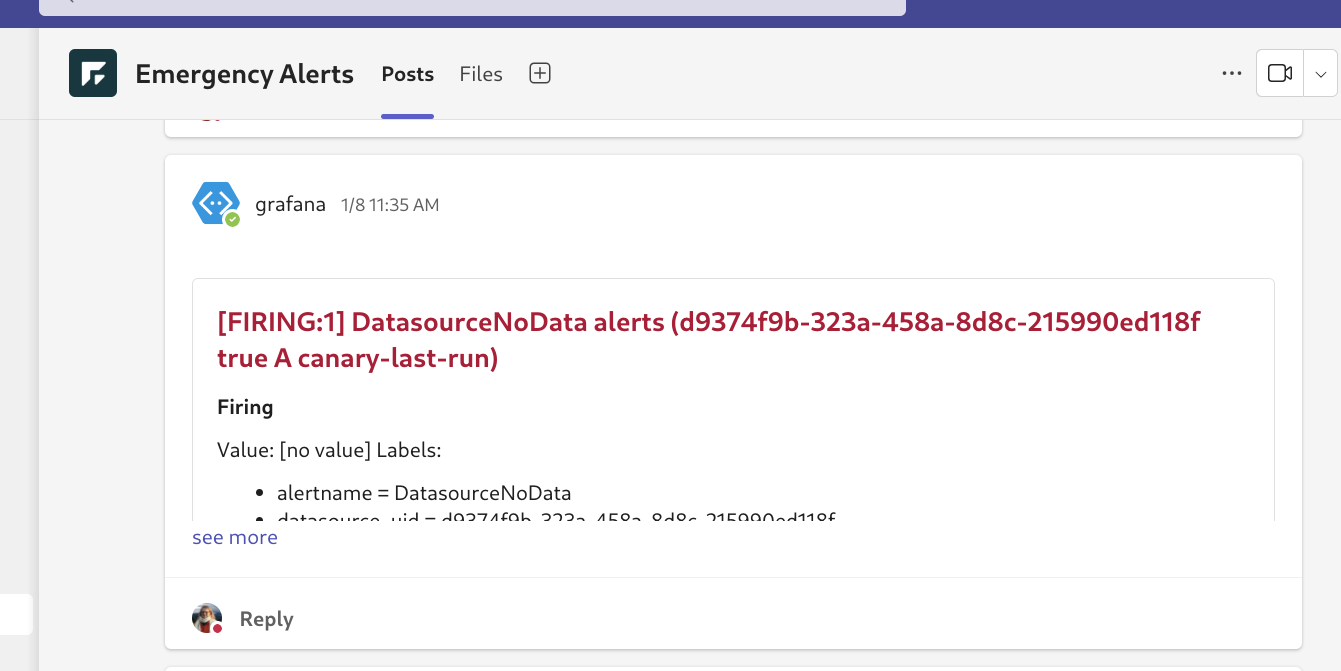
I also added some meta-alerting – now, if Canary hadn’t run its checks for more than a few minutes, its own health checks would fail and we would get an alert from our grafana install.
The problem recurs, inevitably
After a week or so of nervous waiting, the problem happened again — an alert from grafana came through.
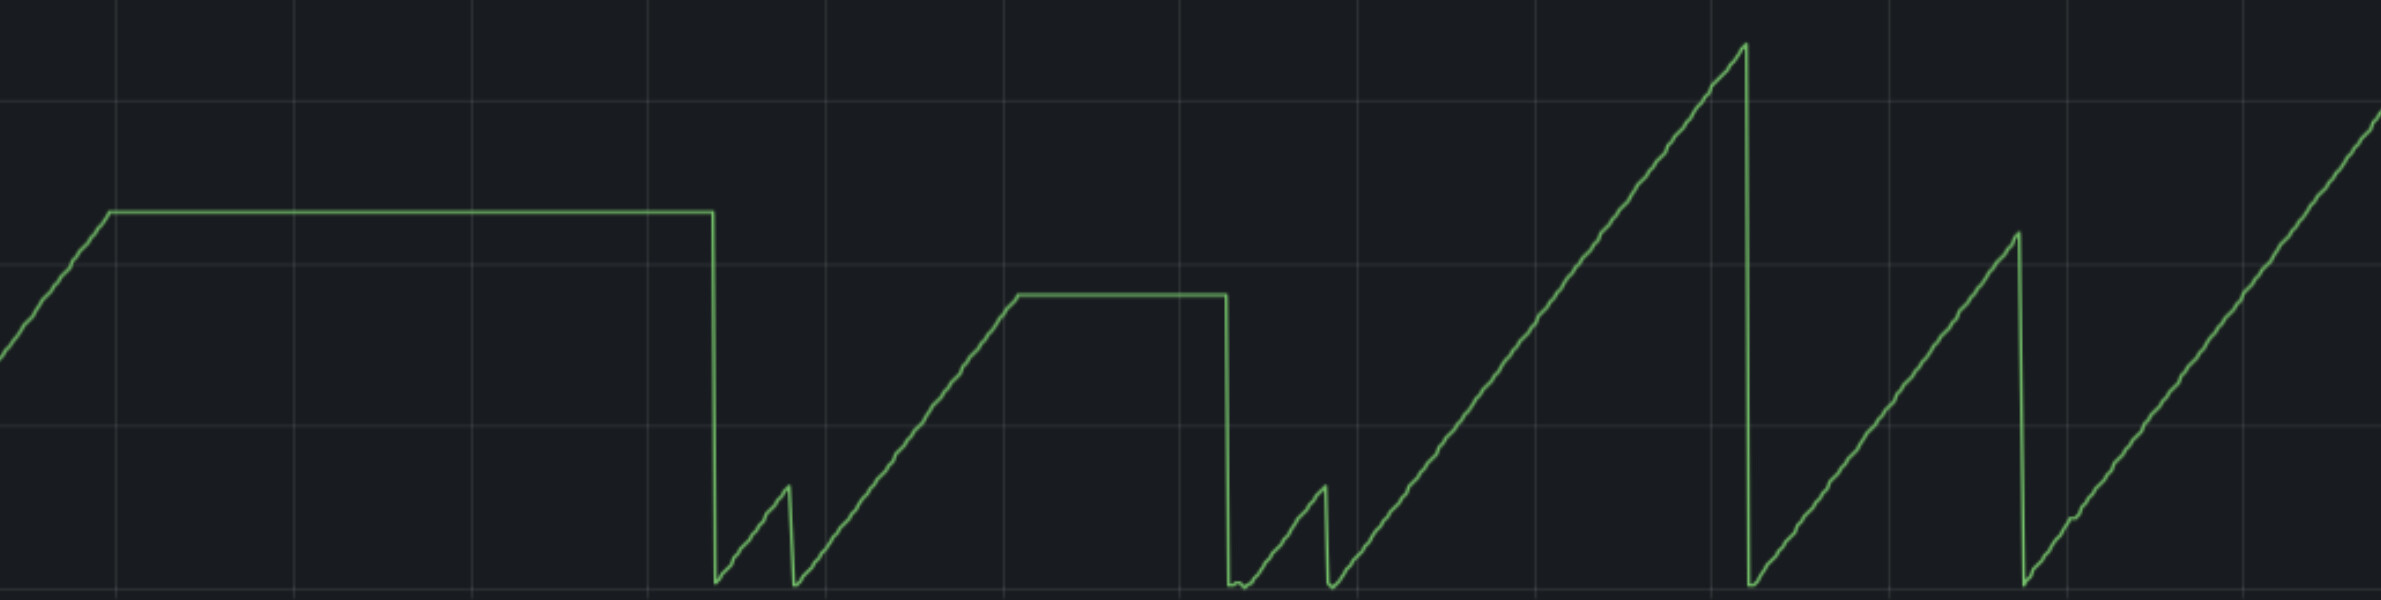
This time, after immediately restarting the container and getting the system back up and running, we had a few more clues. I had enabled all of the reporting available by default using prom-client, the excellent prometheus reporter for nodejs, and one graph in particular looked extremely suspicious.
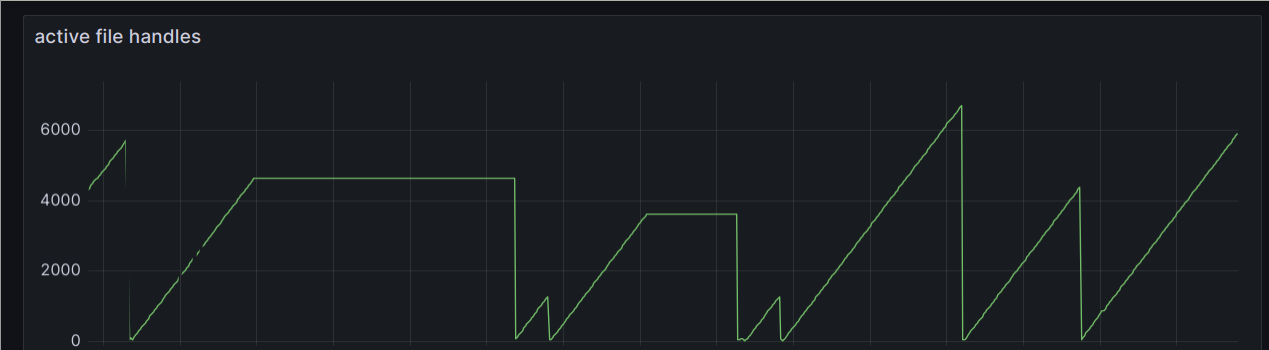
The sawtooth graph is a tell-tale sign of a memory-leak…or at least something like a memory leak. And why the heck are we using so many file descriptors!
We have a file descriptor leak!
But what is a file descriptor leak, anyway? And how do we find it? I found this lovely project that seemed designed for just the thing we were looking for – but the output was noisy, and didn’t seem to be consistent from run to run, at least with our app.
Even if it wasn’t going to be quite as easy as having a node package identify the leaking line of code, knowing that the problem was a file descriptor leak gave us an important place to start looking for answers.
Unix tools to the rescue
As the problem was proving difficult to reproduce in my dev environment, the next step was to (carefully!) poke around in the running production container.
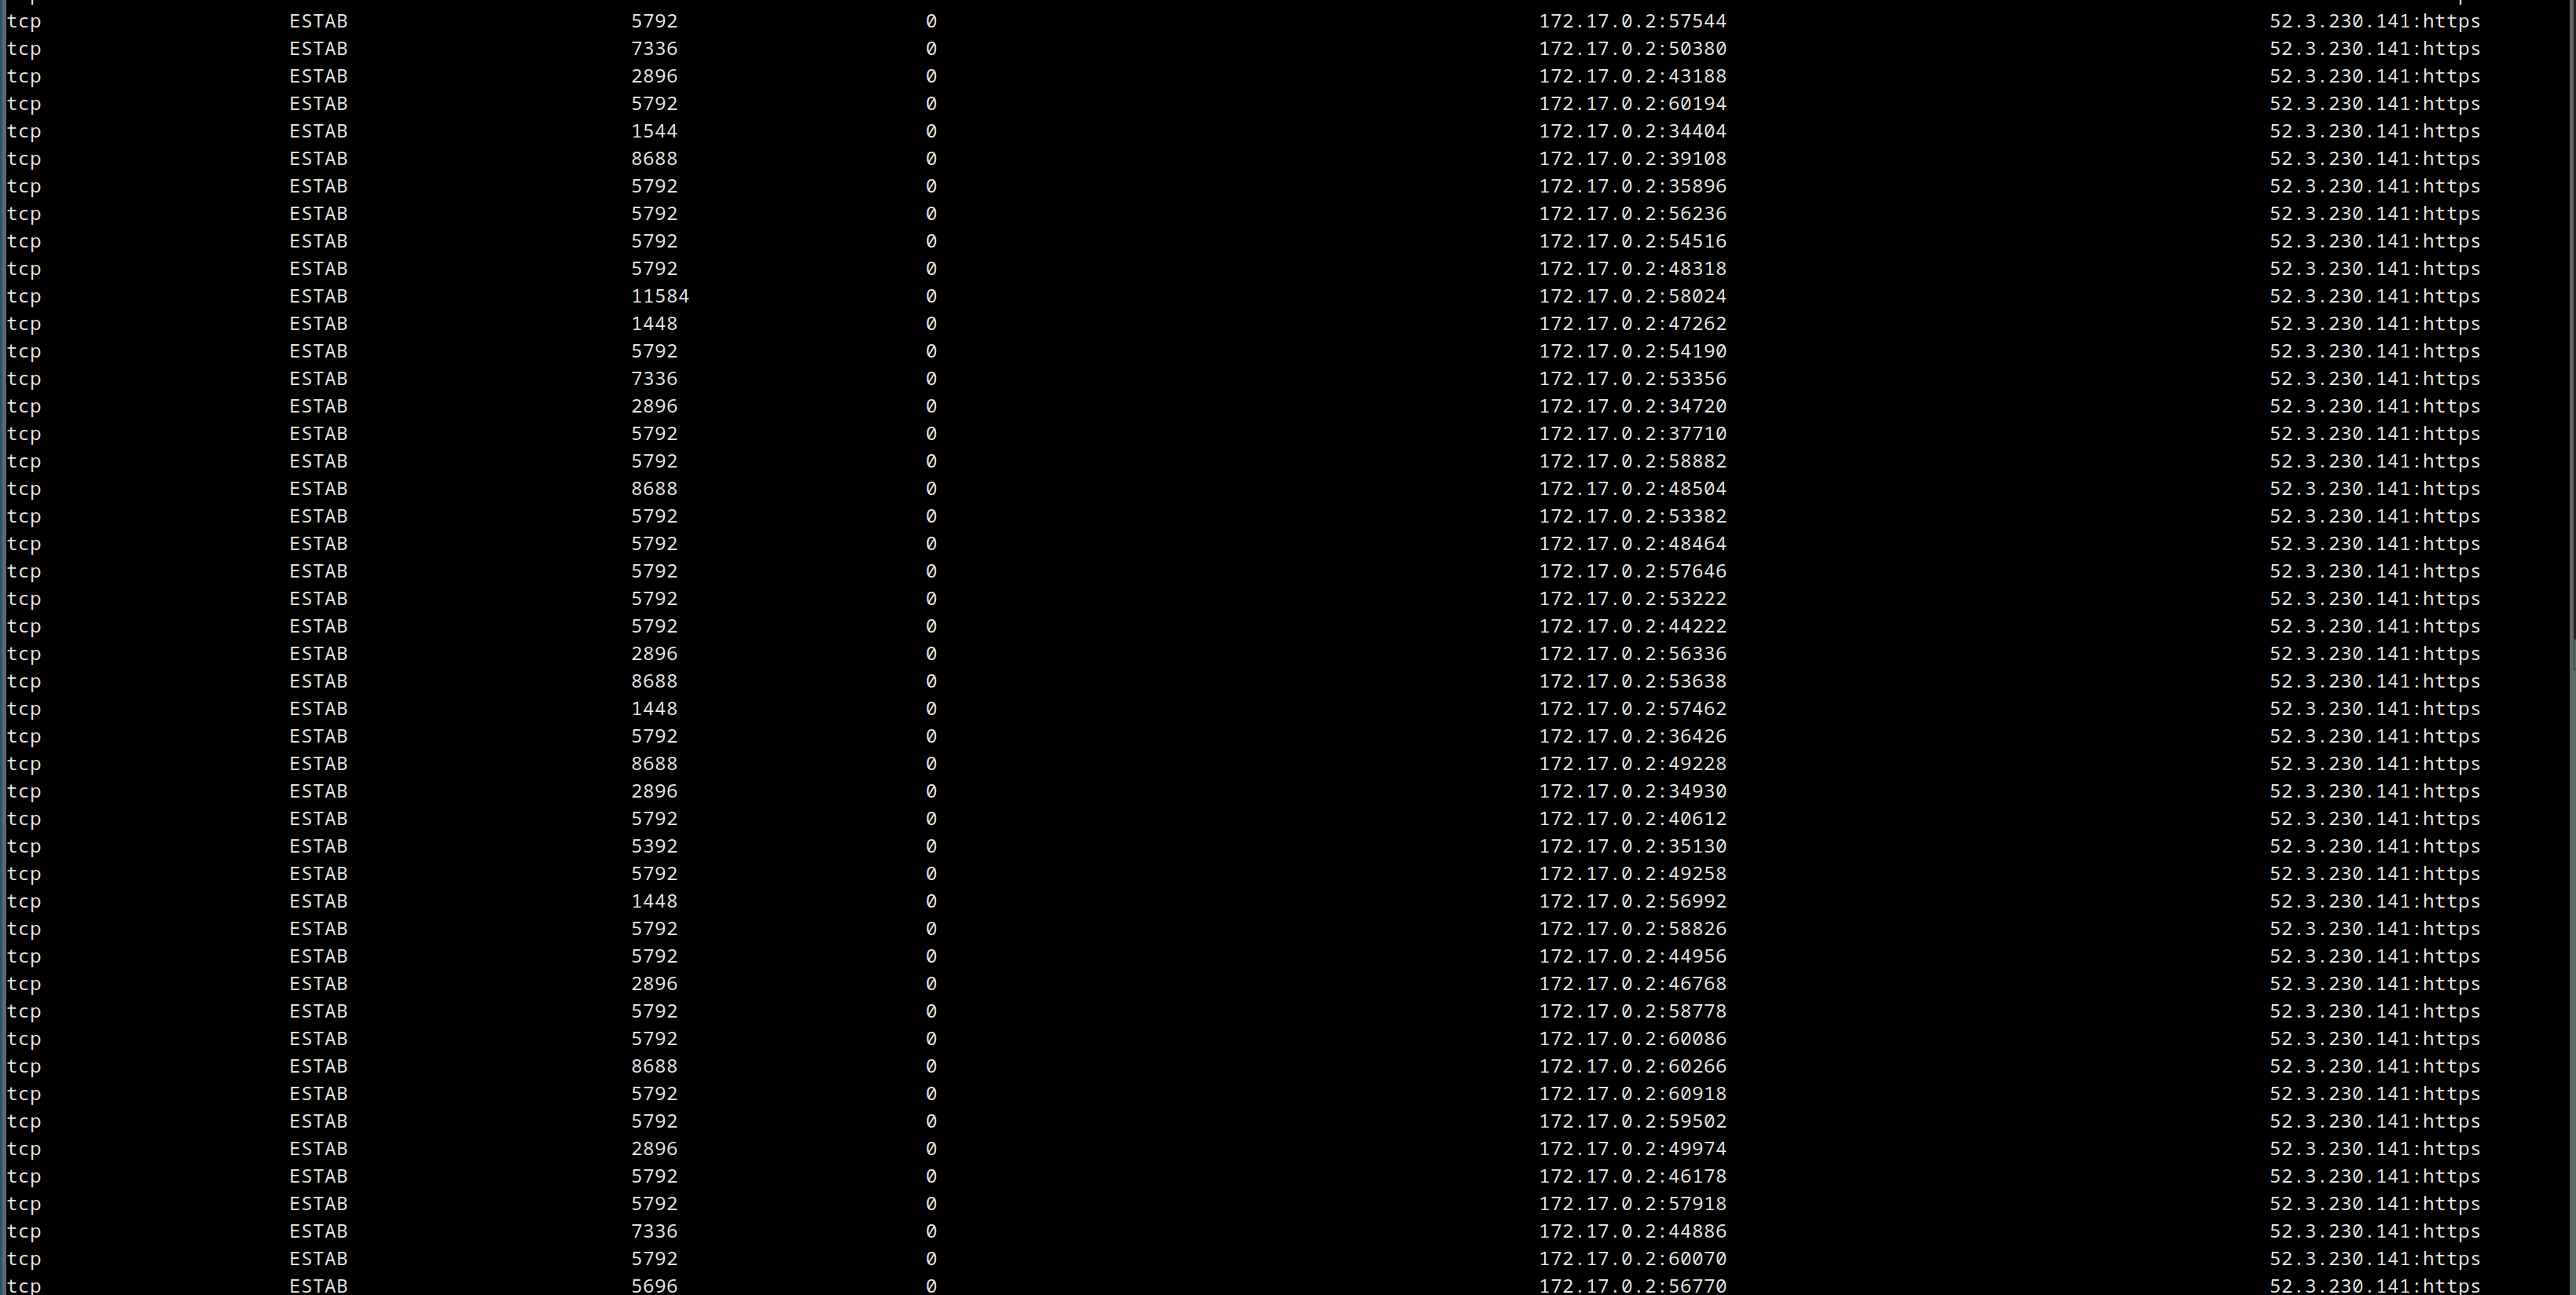
Running lsof -p showed many, many open IPv4 sockets – but where were they going? And what was responsible?
Trawling through the various stack overflow answers related to debugging what I had now narrowed down to a unix socket leak, I came across a new tool – ss (socket statistics). New to me, that is – the tool seems to be /at least/ 20 years old, as this ancient presentation can attest.
This new tool gave me my next critical clue – running it on the prod container showed endless open sockets to the same ip address!
The culprit appears: ssl-checker
Having identified the ip on the other side of the open sockets, the pieces began to fall into place. There was only one code path making calls to that address, and it was calling out to a library that wasn’t used anywhere else: ssl-checker.
The code for that library was simple, clean and readable, so it was hard to tell what could possibly be going wrong. I started deleting code from our application, trying to narrow down to a reproducible proof of concept that something was wrong.
The code I ended up with was the following test:
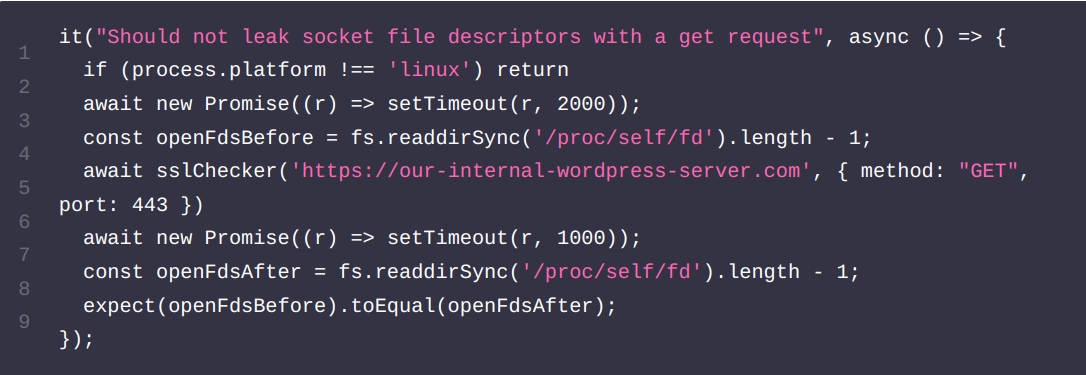
There are a few interesting things to note about the above code:
First of all, it uses a trick stolen from the prom-client library for counting open file descriptors – we can just look in /proc/self/fd – very cool!
Second, we explicitly specify the GET method, rather than the library’s default HEAD. With a HEAD request, there is no leak, with a GET, yes leak.
Third, we call out to our own private endpoint, rather than using https://badssl.com/ as the other tests do. Again here – even with a GET request, the leak would only appear when hitting our own server.
The mystery deepens
Why did the leak happen only with GET requests, and not with HEAD requests? And why did it seem to only happen with our site?
Some experimentation was in order, and I tried some things:
Running the same test against a simple page served by nginx? No leak, even with the GET request.
Running the same test against a simple page served by nginx, with exactly the same headers as our internal server? No leak, even with the GET request.
Running the same test against github.com — aha! We have a leak.
Running the same test against github.com with a HEAD request – no leak again.
What about running the same test against a page served by nginx, but with all of the content from github.com? A HEAD request wouldn’t return that, so maybe that’s the problem…and indeed, we get the leak!
Narrowing it down further – what about a simple nginx server, with default headers, serving a few megabytes of lorem ipsum text. And eureka! There seems to be a threshold of a certain amount of data returned that causes the leak.
A solution – but questions remain
In the end, knowing that the problem was a leaking socket – there was an obvious place in the ssl-checker code where a tls socket object was used, and an opportunity to explicitly close it. This fixed the problem, and a PR submitted with that fix was quickly merged.
But why should we have to close the socket manually, and why only when a certain number of bytes has been received? Based on the documentation here it certainly seems like it should automatically destroy its file descriptor when the server is done sending data.
Clearly I’m still missing a piece of the puzzle here, and it’s driving me a little crazy – so please, if you think you know what might be going on, leave a comment on hacker news, or reach out to me directly at daniel at frameable dot com.
Lessons learned
- Have alerts for your alerts! Monitoring is no good if it can silently stop doing its job.
- Unix tools are awesome –
lsof -p and ss were tremendously useful for debugging this problem.
- It’s still good to be able to run code on your live app servers! Being able to exec into the running production container made the problem much easier to see than in dev environments.
- Grafana and Prometheus save the day with great-looking graphs that don’t take much to get set up in a useful way.
- We can read the number of open file descriptors in linux for our own process by looking in
/proc/self/fd – super useful!